Iceberg melting rates are key indicators of the climate change and global warming challenges facing humanity today. The WHO (World Health Organization) warns that the greatest threat to international food security is climate change. While its effects are experienced over a wide range of situations, it is most graphically illustrated on the globe’s extremities, such as arctic ice masses and icebergs where scientific measurements are often very difficult. This has led to an increase in interest in Arctic Drone Technology.
COP26
The 26th UN Climate Change Conference, COP26, was held in Glasgow on 31 October – 12 November 2021. The theme is: “Uniting the World to tackle Climate Change.” The stated goals of the conference are:

- Secure global net zero by mid-century and keep 1.5 degrees within reach
- Adapt to protect communities and natural habitats
- Mobilize finance
- Work together to deliver
Climate Change and Global Warming indicators
The key indicators of climate change and global warning include a variety of factors, one of which is melting glaciers:
- Areas increasing: Air temperature over the ocean, Sea surface temperature, Humidity is increasing, Temperature of the lower atmosphere, Air temperature over land,
- Global sea level is rising.
- Snow cover is reducing, and snow is melting earlier. Glaciers are melting.
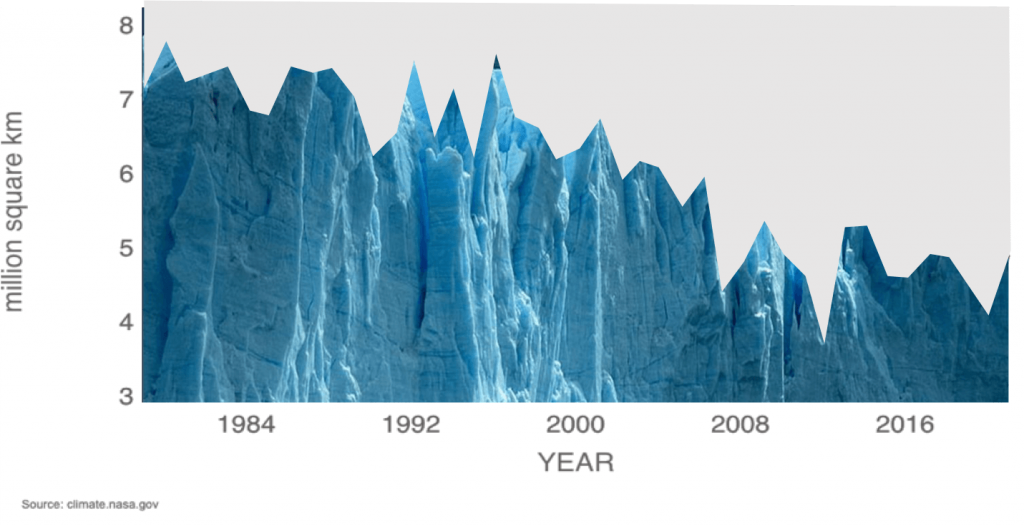
Figures published by NASA show that ice cover in the arctic regions have decreased by about 50% over the last 4 decades.
Glaciers, icebergs, and snow
Glaciers and icebergs represent two of the most important facets of Earth’s ecosystem. While glaciers, icebergs, ice sheets, and permanent areas of snow in the polar regions (the Arctic and Antarctica) comprise 1.7% of the total water on the planet which includes all the saltwater they also account for 68.7% of the world’s freshwater supply. Most of the fresh drinking water living organisms need to survive comes from glaciers and icebergs.
Ice masses such as glaciers, icebergs, ice sheets, and permanent areas of snow in the polar regions account for 68.7% of the world’s freshwater supply
Glaciers and icebergs
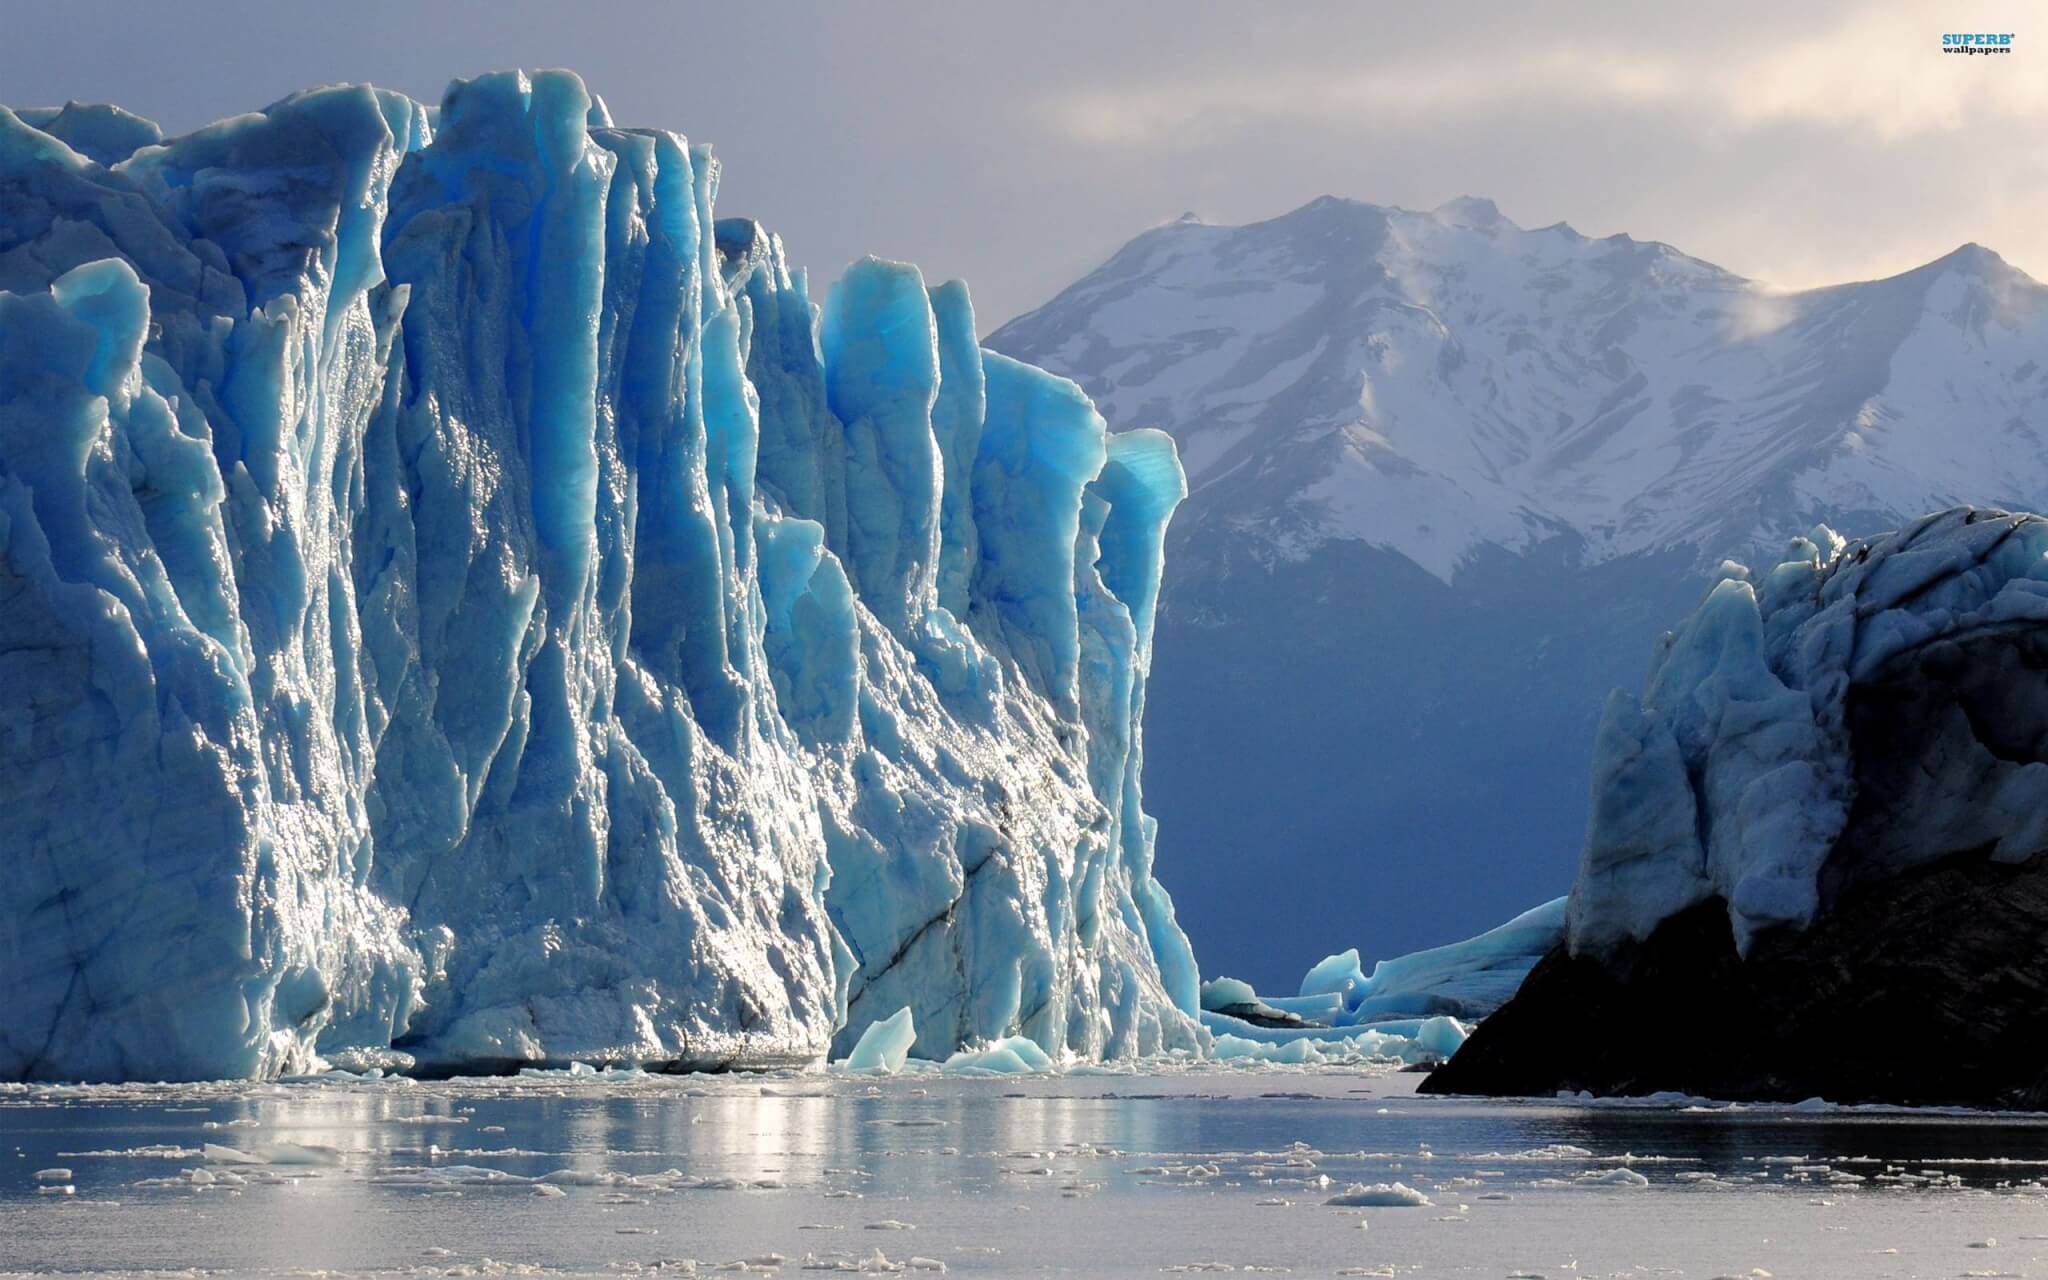
Ice masses such as Glaciers are extensive sheets of ice that start at a central point and spread out as they accumulate more ice and other debris. Glaciers are located in the Arctic and Antarctica, with the largest glaciers appearing in Antarctica.
Icebergs, on the other hand, are smaller pieces of ice that have broken off (calved) from glaciers and now drift with the ocean currents.
Another reason glaciers and icebergs are vital to the rest of the planet is that: glaciers continually grow and release icebergs into the Arctic and Antarctic seas. Those icebergs then follow ocean currents and wind up feeding some of the larger rivers and lakes in the world. Without glaciers and icebergs, many of those critical rivers and lakes would dry up.
About 90% of an iceberg is submerged. And because it melts from the bottom upwards it can be difficult to know the total iceberg mass.
Melting icebergs
The acceleration of glaciers retreat has led to an increase of icebergs discharged in nearby waters. As icebergs melt, they release freshwater into salty ocean waters, impacting local circulation. In order to understand how global circulation will change in the future, we need accurate iceberg melt rates.
“Eureka!”
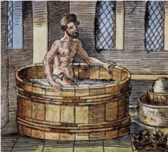
Fortunately measuring the volume of irregular objects with precision has come a long way since the discovery of how to do so by the ancient Greek scholar Archimedes. (By immersing it in water and measuring the displacement of volume – which he discovered while bathing.)
Iceberg melt rates
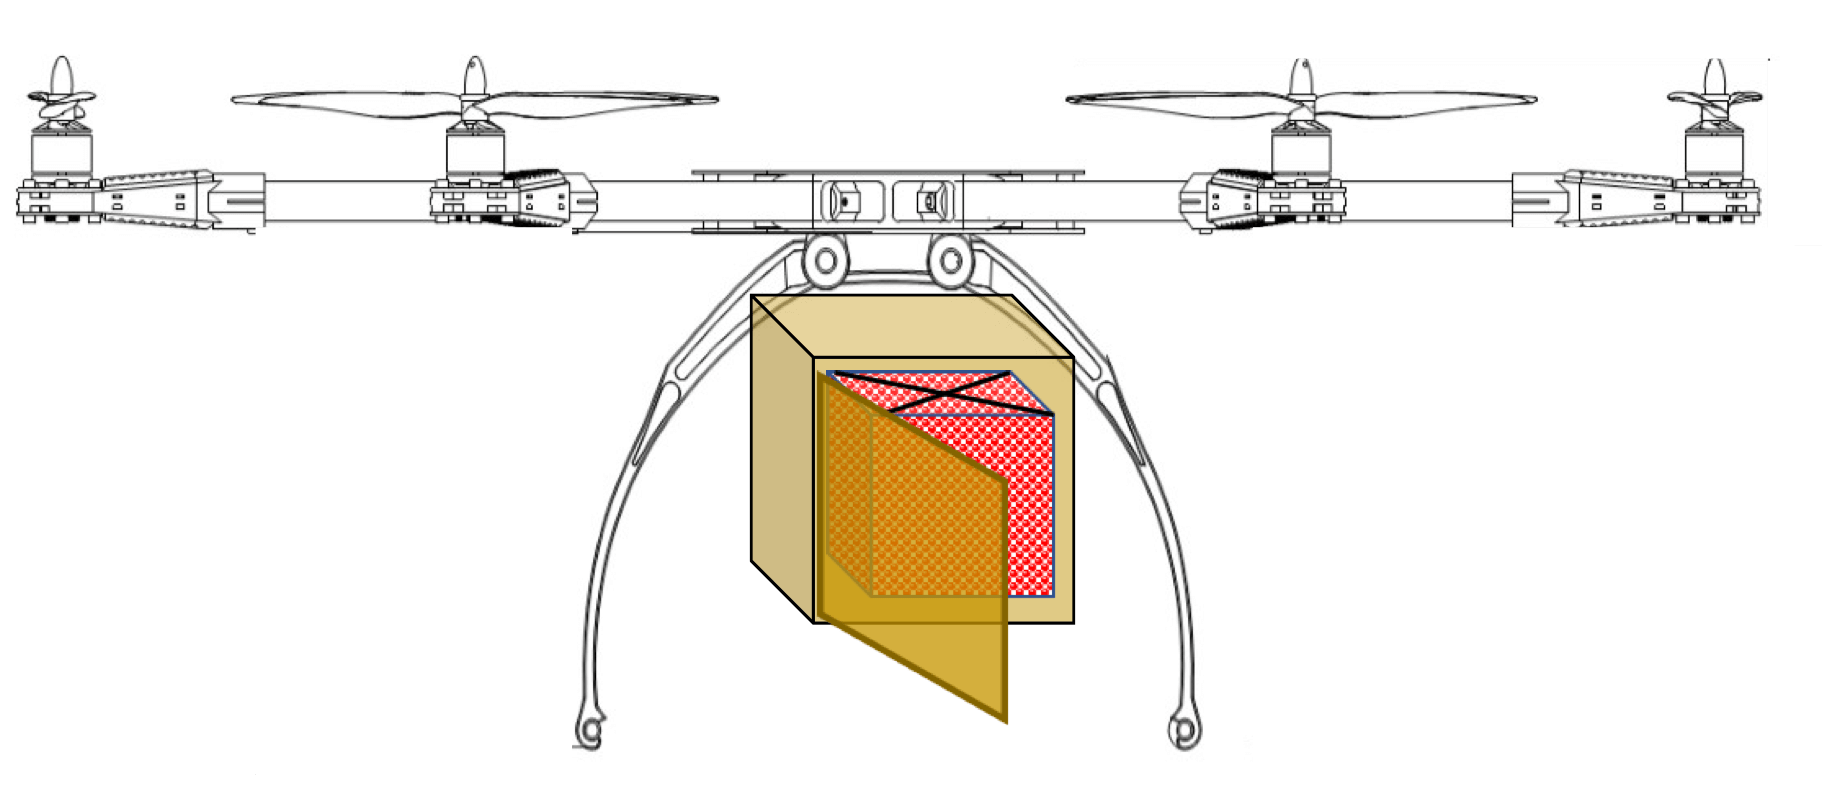
Iceberg melting rates are calculated by using measurements of mass loss from on-iceberg GPS units, and three-dimensional iceberg geometry constructed from aerial drone and subsurface sonar data.
Melting vs Ablation
To measure the effect of global warming and climate change it is important to measure iceberg volume loss attributable to melting rather than ablation (calving).
To do this equations, uncertainties, and dominant deterioration processes were developed over time. These melt calculations also incorporate remote sensing modeling and on-site measurements.
Remote sensing
Remote sensing allows the reach of laboratory measurements to be expanded significantly. However, all not all remote sensing measurements yield the same results. The two main remote sensing options are satellite and drone-based sensors.
Satellite remote sensing
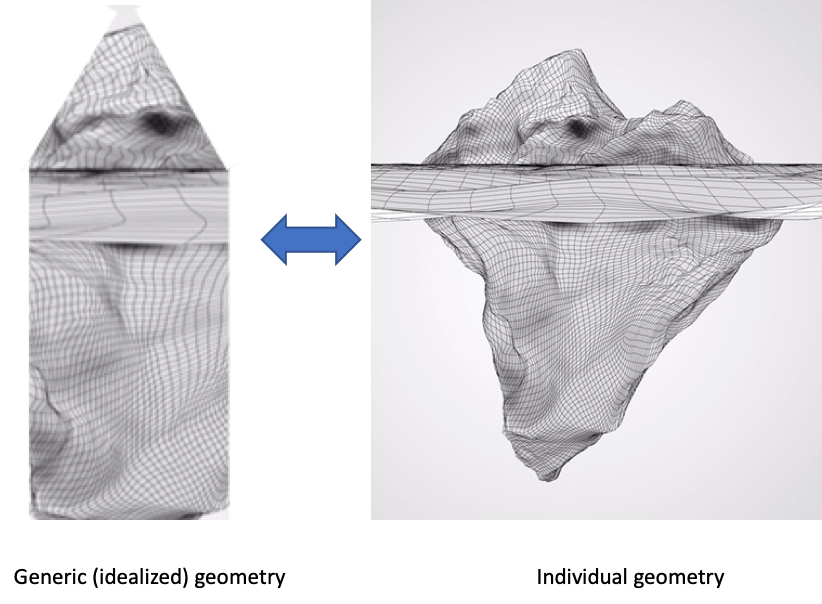
Remote sensing by satelite is limited by its very high altitude and available time during every 24hr cycle. It cannot yet image subsurface iceberg geometry and these modelling exercises therefore assume an idealized subsurface geometry (e.g., cone, cylinder) to calculate melt rate but with large uncertainties.
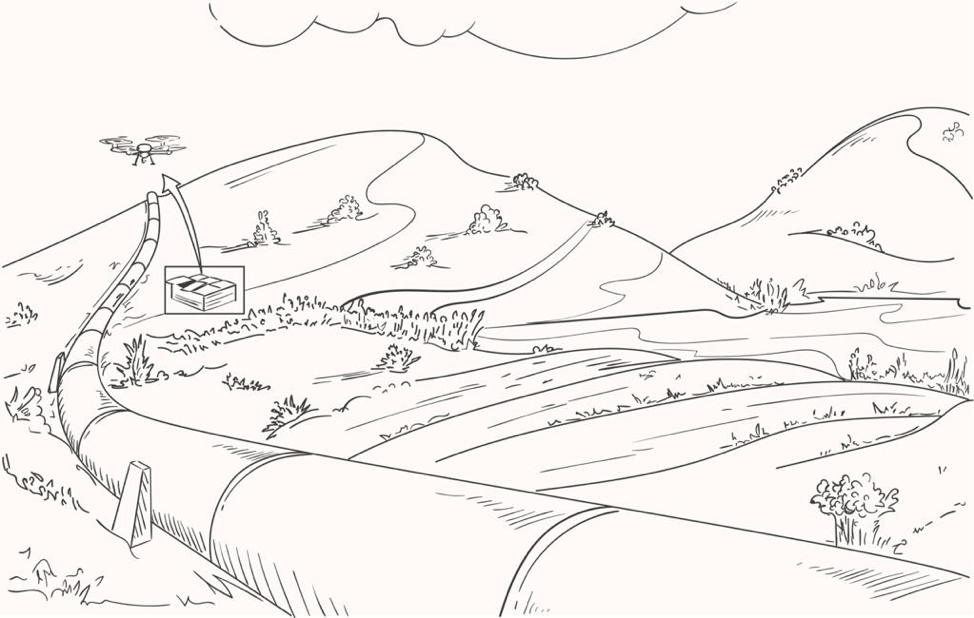
Arctic drone technology
- Ship-based drone, and multibeam sonar, data are used to construct full-iceberg geometries. Volume flux and melt rates are then used to measure surface lowering and iceberg geometry.
- With individual iceberg geometry to calculate volume loss it is possible to derive iceberg melt rates at temporal and spatial resolutions well beyond previous studies.
On-Iceberg GPS
GPS units placed on icebergs can measure iceberg rotation, deterioration, and tipping, as well as iceberg location. By recording the absolute height of each iceberg with these GPS units, other factors not related to melting can be isolated.
Iceberg Measurements
The above-water (surface) iceberg DEM
- Constructed by converting drone imagery to a dense point cloud and a surface mesh.
- During post-processing the surface DEM was used to predict the total iceberg volume (projected iceberg volume) using known values for ice density and on-site average ocean properties according established conductivity, temperature, depth (CTD) profiles.
The subsurface iceberg DEM
Constructed using multibeam sonar
- Point clouds were constructed where gaps as a result of iceberg motion during surveying were corrected for by using the geodetic GPS positions.
- To construct a full-iceberg mesh (reconstructed iceberg) further processing is applied to correct for gaps in subsurface data.
What machines and technology capture information for DEMs?
DEMs are usually generated from remotely sensed data collected by satellites, drones, and planes. This variety of DEM source data means that it’s possible to fill data gaps where little data is available in remote regions.
Remote sensing methods for obtaining DEM surfaces using drones include:
SAR:
- Synthetic Aperture Radar (SAR) data collected using multiple radar images from antennas captured at approximately the same time to create a DEM.
Stereo Photogrammetry:
- in both aerial photography and with satellite imagery, photogrammetry uses images from various vantage points of the same area to obtain depth and perspective where the images overlap.
LiDAR:
- using light, LiDAR measures the reflected light that has bounced off the surface to determine the elevation of the observed surface.
Digitizing contour lines:
- with a contour map, DTMs (a subset of DEMs) is easily digitized and then interpolated programmatically with geospatial software.
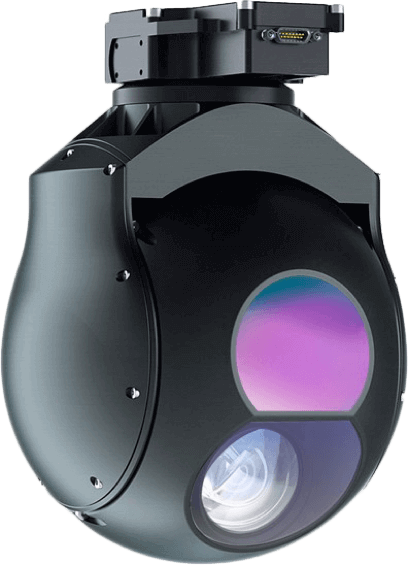
Hyperspectral imaging
- The entire spectrum of frequencies is acquired at each point. Hyperspectral sensors acquire images in many, very narrow, contiguous bands throughout the visible, near-IR, mid-IR, and thermal portions of the spectrum. All available information from the dataset is mined using post-processing. This enables the construction of an effectively continuous reflectance for every pixel in the scene.
- Hyperspectral imaging can also take advantage of the spatial relationships among the different spectra in a neighborhood.
- These systems can discriminate among earth surface features that have diagnostic absorption and refection characteristics over narrow wavelength intervals that are ‘lost’ within the relatively coarse bandwidths of conventional multispectral scanners.
Iceberg Movement & Hydrology
- Icebergs speeds are affected by its contact with seawater that travels in different directions:
- Atlantic-origin water (AW; below ∼150 m), which generally travels up-fjord,
- as opposed to Polar Water (PW; >150 m) traveling down-fjord.
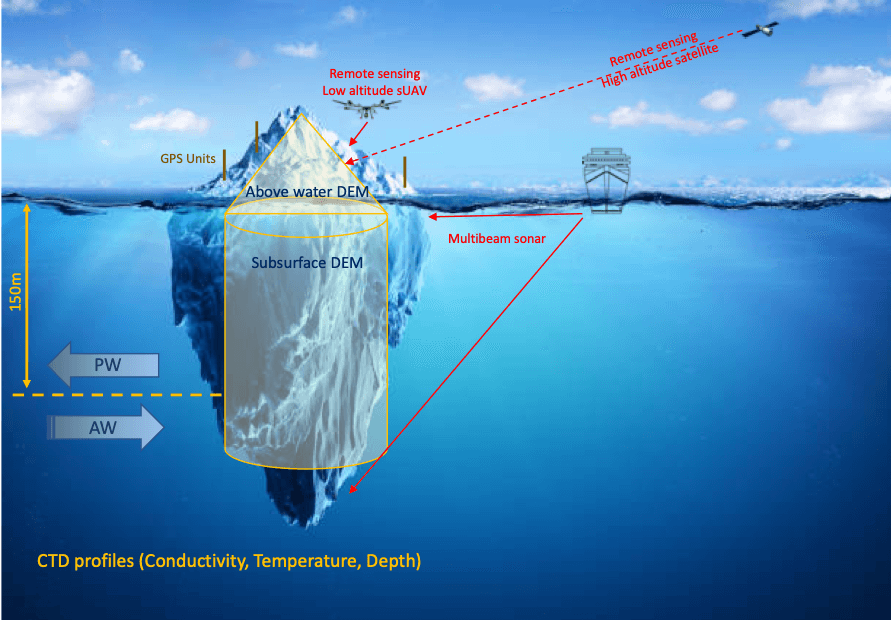
A combination of on-iceberg GPS and ship-based drone and multibeam sonar data is used to construct full-iceberg geometries. These individual iceberg geometries are used to calculate iceberg melting rates
- first based upon GPS surface lowering, and
- then differences in repeat surface DEMs.
The use of individual geometries in melt rate calculations lead to lower iceberg melting rates by at least 22%–43%. This leads to an overestimate in melt rate for the same volume loss based on generalized geometries.
Including iceberg geometry and GPS data to compute on-site iceberg melting measurements improve methods of calculating iceberg mass loss.
The use of drone based aerial data collection in the remote locations of icebergs make a significant by extending the reach of laboratory grade sensors. Repeated survey missions can be conducted on demand from ships in remote, inaccessible locations at low altitudes. This enables the construction of individualized geometries of icebergs for much more accurate projections of the impact of climate change.